Canadian inflation maintained its upward momentum in October, with the headline Consumer Price Index (CPI) increasing by 3.1% year-on-year. The figure came slightly below market expectations of 3.2%, while matching the increase recorded in September. On a monthly basis, consumer prices advanced by 0.2%, indicating that inflationary pressures remain present despite the slight deviation from market forecasts.
Meanwhile, the Bank of Canada's (BoC) core inflation measure, which excludes more volatile components such as food and energy, increased by 2.0% over the past year and advanced by 0.4% compared with the previous month. The monthly increase suggests that underlying price pressures remain relevant, even as the annual measure continues to show a more moderate pace of inflation.
Bank of Canada (BoC) Governor Tiff Macklem appeared before the House of Commons, where he stated that further interest rate increases could become necessary depending on how economic conditions develop. His comments suggest that the central bank remains concerned about inflationary pressures and is not ruling out additional monetary tightening if price stability requires it.
Macklem also added that, under the current circumstances, he does not believe fiscal policy is making the process of reducing inflation more difficult. This suggests that monetary policy remains the primary instrument for addressing inflationary pressures, without significant additional obstacles coming from the fiscal side.
European Central Bank (ECB) Vice President Boris Vujcic stated on Monday that recent developments in Eurozone energy prices could push inflation higher, according to Reuters.
Vujcic argued that artificial intelligence and sovereign debt stand out as particularly significant risks to financial stability. He also added that weaker confidence and rising borrowing costs should partially contain excessive inflationary pressures by weighing on economic growth.
Eurozone industrial production increased by a modest 0.2% month-on-month in September, following a 0.5% contraction in August, according to data published by Eurostat. Although the indicator returned to positive territory for the first time after three consecutive months of declines, the result came below market expectations of a 0.6% increase.
On a year-on-year basis, industrial production declined by 1.5% in September, following a 1.1% contraction in August, extending its downward trend to five consecutive months. This suggests that industrial activity across the Eurozone continues to face difficulties despite the latest monthly improvement.
Technical Analysis
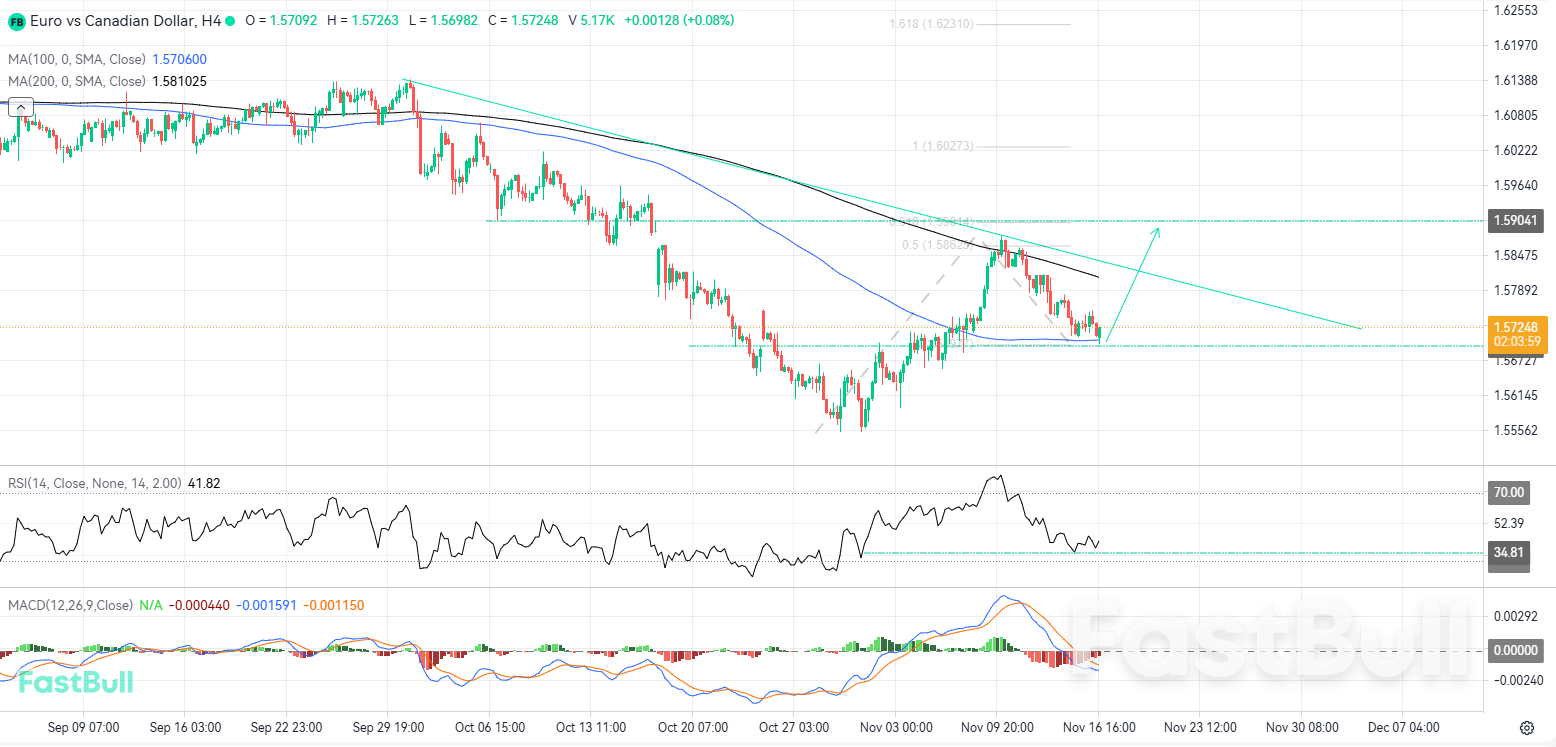
EUR/CAD recently pulled back after reaching the 200-period moving average, currently located at 1.5810. The rejection from this level pushed the pair toward the 100-period moving average at 1.5706, where price action is now finding support. Interestingly, this local support area also coincides with the 0.50 and 0.618 Fibonacci retracement levels, creating a confluence of technical factors that could mark the end of the current pullback and allow the bullish movement to resume.
If buyers manage to defend this area, the pair could begin recovering toward the resistance level at 1.5904, which coincides with the 0.618 Fibonacci extension level. However, a renewed upside movement would first require a breakout above the descending trendline, which is currently aligned with the 200-period moving average. A successful break above this structure would provide additional confirmation for a potential continuation toward the previously identified resistance zone.
Regarding the oscillators, the RSI recently declined to 34, approaching oversold territory. However, the price movement has not been proportional to the decline in the indicator, as the pair experienced a relatively limited downside movement compared with the RSI's drop. This divergence in momentum suggests that sellers could be losing strength relatively quickly, potentially limiting further downside pressure.
Meanwhile, the MACD displays a bearish histogram that has lost almost all of its previous depth, while both signal lines recently crossed below the neutral level. Despite this bearish positioning, the reduction in histogram depth suggests that selling momentum is weakening. A bullish rejection from the current support area could push both MACD components back toward positive territory, providing additional support for a recovery and potentially allowing the pair to resume its broader upside movement.
Trading Recommendations
Trading direction: Buy
Entry price: 1.5724
Target price: 1.5900
Stop loss: 1.5630
Validity: Nov 27, 2026 15:00:00


