Overview
XAU/USD is entering the session after an aggressive upside expansion, with spot gold touching $4,434.84, its highest level since 5 June, before retreating approximately 0.5% toward $4,365. The subsequent price action around $4,375 is important because it places the market close to the breakout area while remaining substantially above the recent consolidation structure. Trading Economics currently places gold around $4,374, with the metal still up more than 9% over the past month, demonstrating that the move is not merely a one-session spike but part of a broader recovery.
The macroeconomic backdrop continues to favour gold. The latest US employment data weakened expectations for a near-term Federal Reserve rate hike, reducing the opportunity cost of holding a non-yielding asset such as gold. At the same time, investment flows have strengthened and central-bank accumulation continues to provide structural demand. China reportedly added approximately 20 tonnes to its reserves in July, reinforcing the longer-term demand picture. (
Reuters)
However, the rally is now entering a technically more difficult area. The move above $4,400 has already attracted profit-taking around $4,430–$4,435, and current technical commentary warns that momentum is becoming stretched after the rapid advance. Therefore, buying at $4,375 is more attractive if the level behaves as a higher-low support zone rather than if price simply falls through it.
Market Sentiment
Market sentiment remains predominantly bullish toward gold, but the composition of that bullishness is changing. The initial catalyst was clearly the deterioration in US labour-market expectations, which lowered the probability of an immediate Fed tightening move. Gold benefited because falling expectations for interest rates reduce the relative disadvantage of holding bullion. At the same time, geopolitical uncertainty surrounding the Middle East and renewed tensions involving Iran are supporting defensive demand. (
Reuters)
The important risk is that bullish positioning has become crowded. Current commentary indicates that more than 60% of open gold positions are long, while the market has already advanced more than 10% from its recent yearly low. This does not automatically imply a reversal, but it means that a stronger-than-expected US inflation number could produce a disproportionately large pullback as leveraged longs reduce exposure.
For the BUY thesis around $4,375, the fundamental argument is therefore not simply "gold is going up." The stronger argument is that the market has broken from consolidation, macro conditions have shifted toward lower expected rates, and price is currently testing the previous breakout region. If $4,350–$4,375 develops into support, the risk/reward structure becomes substantially more favourable than chasing price near $4,430.
Technical Analysis
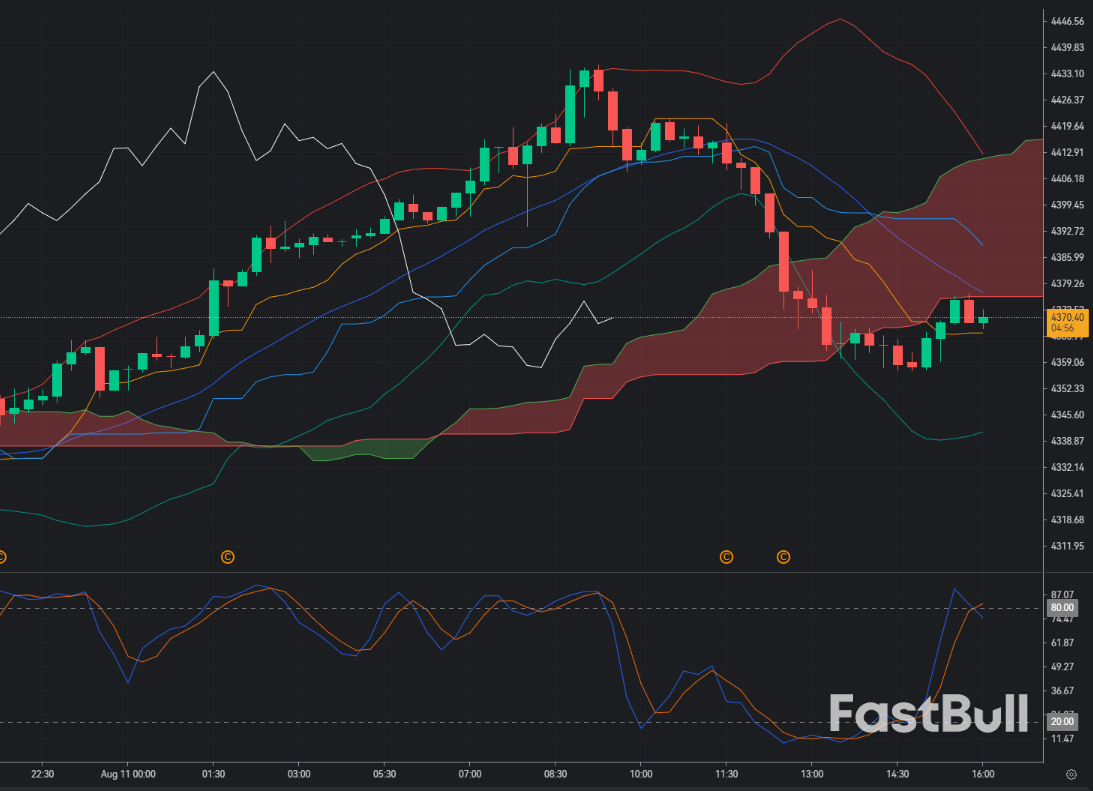
Using Bollinger Bands (20,0,2), Ichimoku (9,26,52), and Stochastic (5,3,3), the M15 structure remains bullish as long as price can maintain the higher-low formation above the recent breakout zone. Bollinger Bands should remain expanded following the impulsive move, and a successful M15 stabilization around $4,375 would indicate that volatility is being absorbed rather than that the trend is reversing. A sequence of candles reclaiming the upper half of the Bollinger structure would strengthen continuation toward the previous high.
Ichimoku provides the most important trend filter. A BUY setup remains technically healthier while price stays above the Kumo and the Tenkan-sen remains above the Kijun-sen. The ideal bullish configuration is a pullback toward the Tenkan/Kijun area followed by renewed upside momentum without a decisive M15 close inside the cloud. If price instead breaks below the Kijun and enters the Kumo, the immediate bullish structure becomes considerably weaker.
Stochastic (5,3,3) needs more careful interpretation because the indicator can remain overbought during a powerful trend. A temporary bearish crossover is not sufficient by itself to invalidate the BUY thesis. The stronger bullish signal would be Stochastic resetting from the overbought area and then crossing upward again while price holds $4,350–$4,375. Conversely, a sustained move below the midpoint accompanied by an Ichimoku breakdown would suggest that the pullback is becoming deeper.
The major technical map is therefore $4,350–$4,375 as the key support/retest area, $4,400–$4,435 as immediate resistance, and approximately $4,460–$4,477 as the next upside expansion zone if the recent high is decisively broken. Current market analysis also identifies $4,500 as an important psychological resistance beyond that zone.
Trade Recommendation
Entry: 4,375
TP: 4,460
SL: 4,335