Overview
Gold enters the new week with a substantially different structure from the sharp selloff immediately following last week's Federal Reserve decision. The Fed raised rates by 25 basis points to 3.75%–4.00% and maintained a hawkish outlook, initially driving XAU/USD down to approximately $4,235. However, the metal subsequently recovered above $4,300 and is now trading around $4,365–$4,372. This recovery is significant because the market absorbed the initial rate-hike shock rather than continuing directly toward the $4,200 support zone.
The proposed $4,365 entry is therefore positioned around a major short-term decision point. Current analysis identifies $4,340–$4,370 as the immediate resistance area, with $4,400 becoming the next important recovery level if buyers can establish a sustained breakout. At the same time, $4,300 has become the key pivot below the market. The earlier $4,305–$4,319 region was identified as a major technical support confluence, so holding above this zone strengthens the argument that the recent decline was corrective rather than the beginning of a larger structural reversal.
The macro environment remains contradictory. U.S. yields and the dollar continue to restrict gold because another Fed hike remains possible, with current market pricing putting the probability of an October increase around 56.5%. However, much of the hawkish repricing has already occurred, allowing gold to recover as traders reassess whether further tightening will actually be sufficient to generate another major leg lower.
Market Sentiment
The current sentiment is cautiously constructive toward gold rather than unambiguously bullish. The most important evidence is the speed of the recovery after the Fed-driven liquidation. Gold fell dramatically toward $4,235 but quickly regained $4,300, indicating that buyers were willing to absorb supply below that psychological level. Technical analysis now describes the market as stabilizing above the 100-day SMA while remaining below the Bollinger middle band on the daily chart.
Safe-haven demand also remains relevant because Middle East tensions continue to create uncertainty around energy markets. However, this factor has a double effect: geopolitical escalation can increase demand for gold, but higher oil prices can also strengthen inflation expectations and reinforce the case for tighter U.S. monetary policy. FXStreet notes that Fed officials have continued to emphasize inflation above 3%, keeping the dollar and yields as important obstacles for gold.
For the BUY at $4,365, the critical sentiment shift would therefore come from buyers demonstrating that $4,370 can be converted from resistance into support. A simple spike through $4,370 would not be sufficient. An M15 close above the level followed by a successful retest would provide much stronger evidence that the recovery has transitioned into another upside leg.
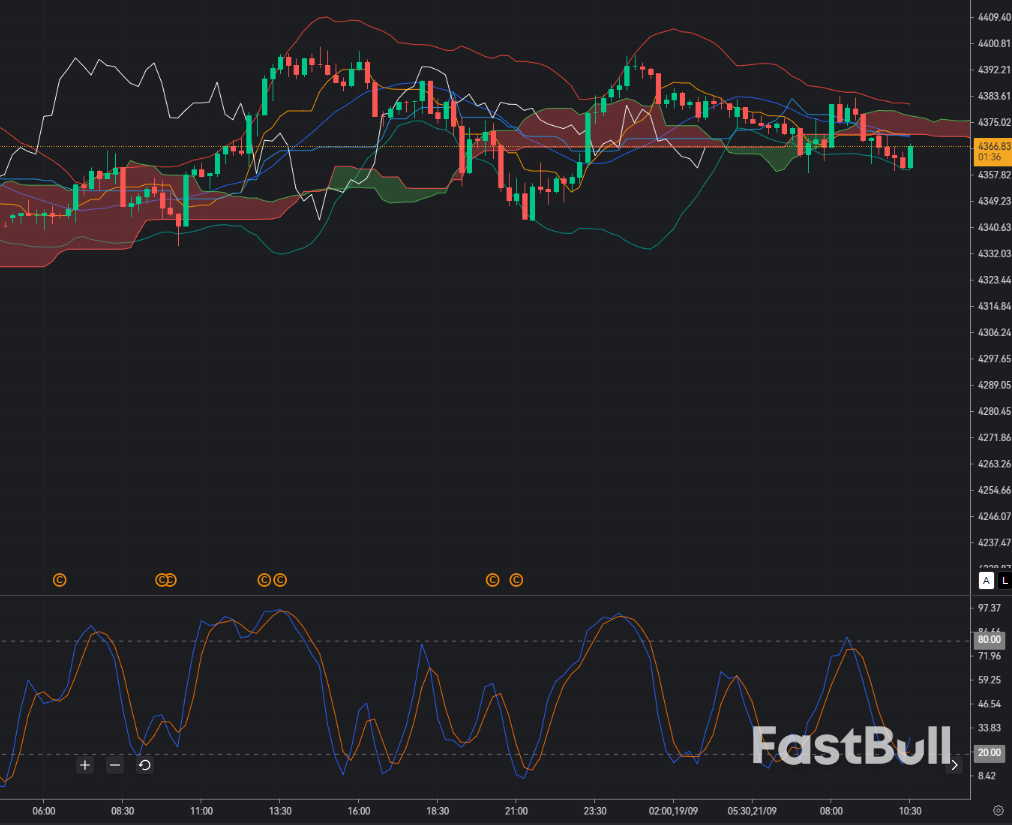
On M15, $4,365 is located immediately below the $4,370 resistance boundary. This makes the setup a breakout BUY rather than a conventional support BUY. Current market analysis identifies $4,370 as immediate resistance and $4,400 as the next important recovery objective, while $4,300 remains the key downside pivot.
With Bollinger Bands (20,0,2), the preferred structure is for price to break above the M15 middle band and expand toward the upper band. Because gold is already close to $4,370, chasing an extended candle would increase the risk of a false breakout. The cleaner signal is an M15 close above $4,365–$4,370 followed by a shallow retest that holds above $4,355–$4,360.
For Ichimoku (9,26,52), the BUY becomes stronger if price moves above the Kijun-sen and subsequently establishes the cloud as support. A bullish Tenkan/Kijun configuration would indicate that the recovery has gained internal momentum. If price breaks $4,370 but immediately falls back below the Kijun and cloud, the breakout should be treated as potentially false.
The Stochastic (5,3,3) is the key timing filter. Since gold has already rallied substantially from $4,235, buying while Stochastic is extremely overbought carries a higher probability of a short-term pullback. The preferable configuration is a breakout above $4,370 followed by a brief Stochastic reset and bullish cross while price remains above the broken resistance. This would show that momentum is being rebuilt rather than exhausted.
The upside structure points first toward $4,400, followed by the $4,440–$4,450 region if momentum accelerates. Conversely, failure to hold $4,350 after the breakout would weaken the setup, while a sustained move below $4,300 would invalidate the current recovery structure and reopen the $4,250–$4,200 downside zone. Current technical research similarly identifies $4,300 as pivotal support and $4,340–$4,370 as the immediate resistance band.
Trade Recommendation
Entry: 4365
Take Profit: 4400
Stop Loss: 4338