Overview
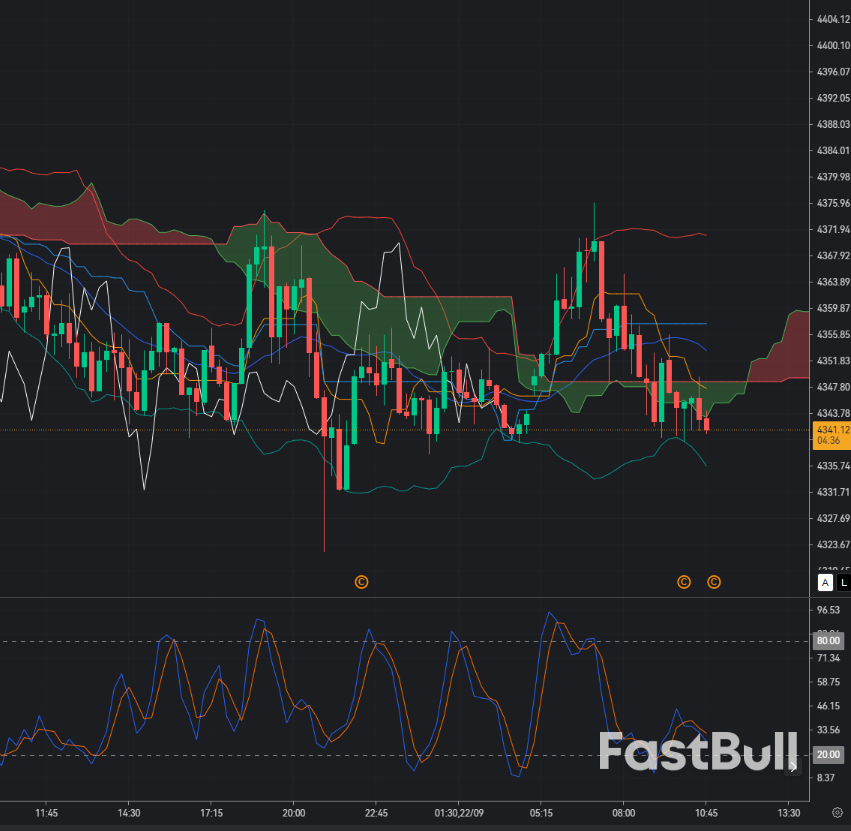
XAU/USD is currently hovering around $4,344, very close to the proposed $4,350 entry. Reuters reports that spot gold was $4,344.29 early Tuesday, with the market struggling for momentum as investors reassess the prospect of U.S. rates remaining elevated for longer. The key change from last week's post-Fed selloff is that gold has managed to recover from the $4,230–$4,260 region and return toward $4,350, showing that demand has reappeared after the initial liquidation.
The $4,350 area is technically significant because recent analysis places initial support around $4,340–$4,350 and secondary support around $4,300–$4,320. Meanwhile, the 100-day EMA is around $4,367, creating immediate overhead resistance just above the proposed entry. This creates a relatively tight M15 battle: buyers need to defend $4,340–$4,350 and reclaim $4,367, while sellers will attempt to turn that EMA into resistance.
The macro backdrop is still not straightforward. The Fed recently raised rates by 25 bps and indicated that further tightening may be necessary, while higher oil prices could reinforce inflation expectations and make another rate increase more likely. At the same time, Treasury yields have eased somewhat, reducing one of gold's immediate headwinds. The BUY therefore relies on the market continuing to absorb the hawkish Fed message without another substantial rise in yields.
Market Sentiment
Gold sentiment is currently mixed rather than decisively bullish. The metal is benefiting from geopolitical uncertainty and some easing in U.S. yields, but traders remain cautious because the Fed's policy path is still restrictive. Reuters specifically notes that investors are watching Fed officials for clues about another potential October increase, while crude-oil movements remain important because renewed energy inflation could strengthen the case for tighter monetary policy.
The important observation is that gold has not broken the $4,300–$4,320 support structure despite the hawkish repricing. Current technical analysis identifies $4,320–$4,300 as the next major support below $4,350. That suggests buyers are still defending the recovery, but $4,400 remains a much stronger test. Recent analysis places resistance around $4,395–$4,410, with $4,430–$4,465 above it.
For the BUY at $4,350, the critical signal is therefore whether price can establish $4,340–$4,350 as a base and then push through $4,367. If that happens, the move toward $4,400 becomes technically more credible. If $4,340 fails, however, the position is vulnerable to another test of $4,300–$4,320.
On M15, $4,350 is a support-retest entry rather than a breakout entry. Price is currently close to this zone, while the 100-day EMA around $4,367 provides the first major obstacle. The ideal structure is an M15 rejection below $4,340 followed by a reclaim of $4,350, or a successful retest of $4,350 after price briefly trades above it.
With Bollinger Bands (20,0,2), the preferred BUY setup is for price to hold the lower-to-middle band region around $4,340–$4,350 and then expand toward the upper band. Recent four-hour analysis places the middle Bollinger level around $4,347 and the upper band near $4,412, supporting the idea that $4,350 is currently close to the mean rather than an extended buying level.
For Ichimoku (9,26,52), buyers need M15 price to reclaim the Kijun-sen and ideally move through the cloud. A bullish Tenkan/Kijun configuration while price remains above $4,350 would indicate that short-term momentum is shifting back toward buyers. If the cloud continues to reject price around $4,360–$4,370, the recovery would remain vulnerable to another decline.
The Stochastic (5,3,3) should ideally turn upward from the lower-middle region rather than remain heavily overbought. A bullish crossover while XAU/USD holds $4,340–$4,350 would provide better timing confirmation. The strongest continuation would be a Stochastic bullish cross followed by an M15 close above $4,367.
The first upside target is $4,390, approaching the larger $4,395–$4,410 resistance zone. A successful break above $4,400 could then expose $4,430–$4,460. Conversely, an M15 close below $4,325 would weaken the support-reversal structure and reopen $4,300 and potentially $4,240.
Trade Recommendation
Entry: 4350
Take Profit: 4390
Stop Loss: 4325