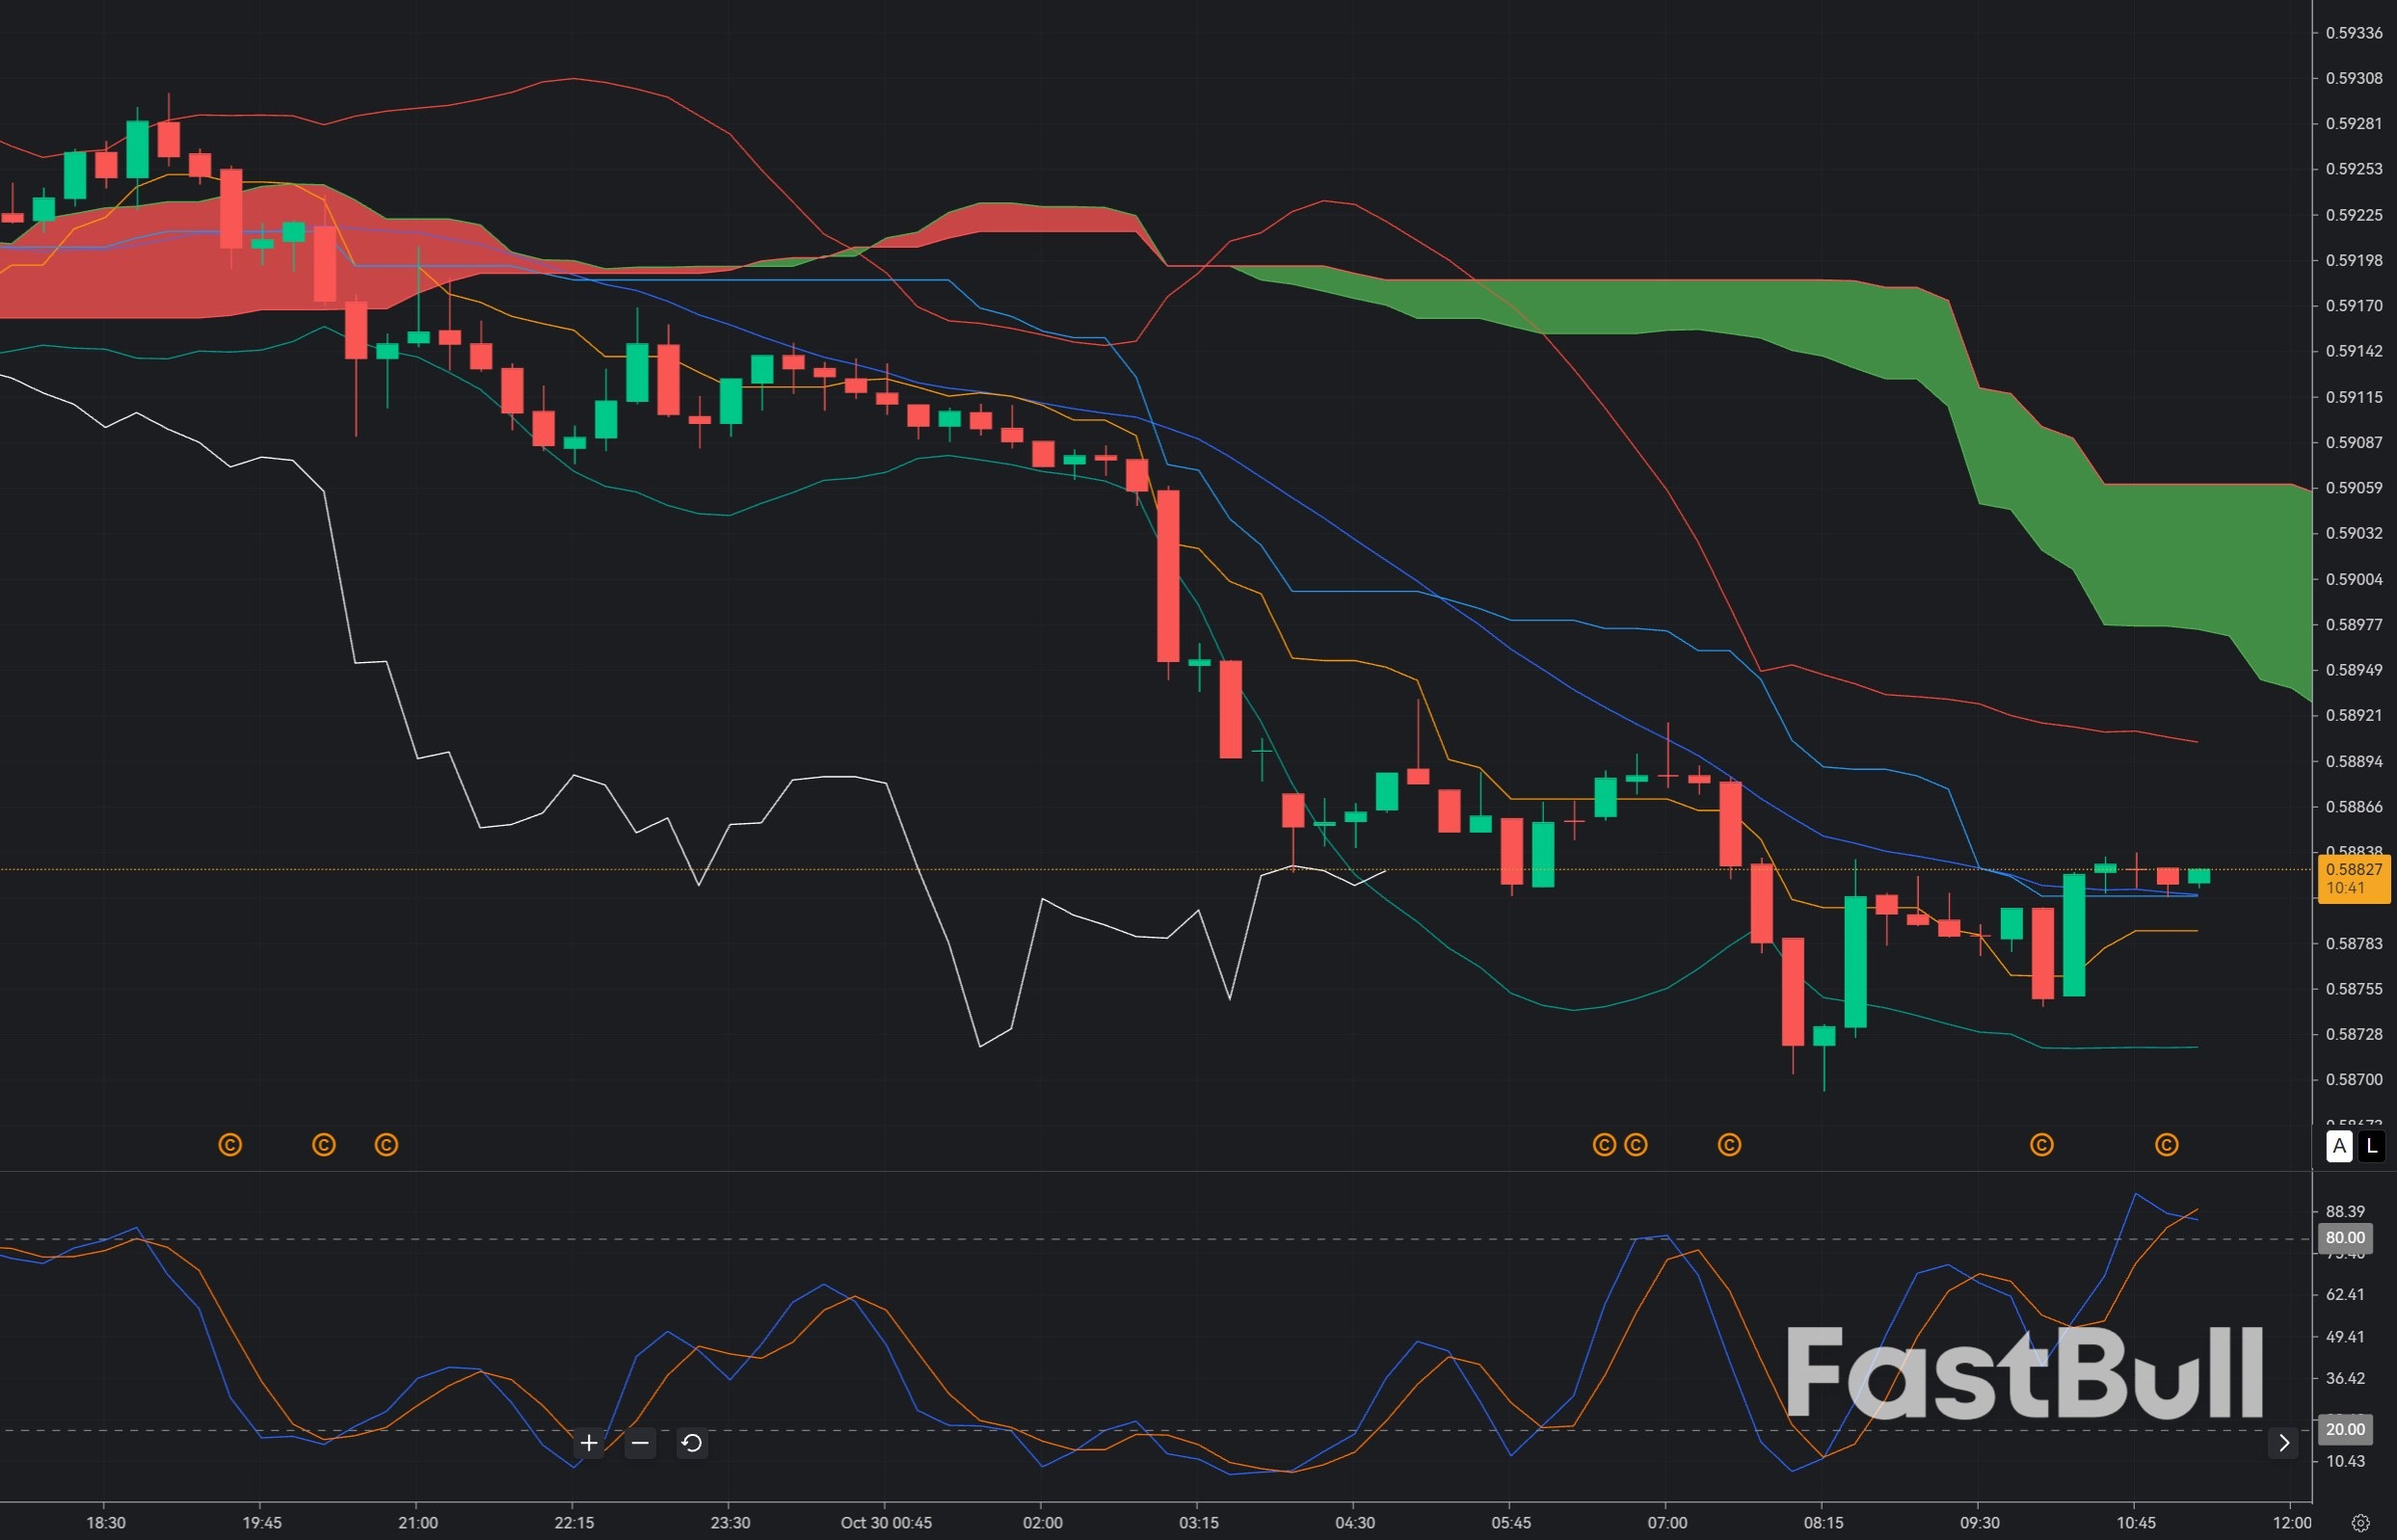
Market Overview
The Canadian dollar has received a potential fundamental tailwind from the Bank of Canada's recent decision to raise its policy rate by 25 basis points to 2.50%. The central bank cited resilient global economic activity and persistently elevated energy prices, which have contributed to higher inflation across several economies. Higher Canadian interest rates may improve the currency's yield appeal, although the actual impact depends on whether markets had already anticipated the increase.
The Swiss franc presents a different policy backdrop. The Swiss National Bank maintained its policy rate at 0% at its September assessment, while retaining the option to intervene in foreign-exchange markets if necessary. This comparatively accommodative rate environment may favour CAD over CHF from a yield perspective, provided global risk sentiment remains stable.
However, the immediate price action is less supportive. CAD/CHF declined from the 0.5920–0.5931 region, and the latest available historical data records a fall toward 0.5882 on 29 October. Your proposed 0.5885 entry sits close to this recent low, making it a plausible support-based BUY rather than a confirmed continuation signal.
The main risk is that the market has begun pricing in weaker Canadian growth or that investors are seeking the Swiss franc as a defensive asset. Canada's latest GDP release and Swiss economic indicators warrant attention because unexpected weakness in Canada or stronger demand for safe-haven currencies could overwhelm the interest-rate advantage. The BUY thesis therefore depends on buyers defending support rather than on monetary policy alone.
Market Sentiment
Short-term sentiment is bearish despite the relatively supportive medium-term fundamental backdrop. The latest available technical summary for 30 October reports RSI(14) near 30.2, Stochastic near 16.9, MACD in negative territory and ADX around 34.6. Together, these readings indicate strong selling pressure and an oversold market, but they do not establish that a reversal has begun.
This distinction matters for an entry at 0.5885. An oversold market can rebound sharply when sellers take profits, especially near a previously tested low. Equally, strong directional momentum can keep pushing prices downward despite an oversold oscillator. Buying before a clear reversal appears would therefore mean trading against the prevailing short-term momentum.
The more constructive scenario would involve price testing 0.5880–0.5885, rejecting lower prices and recovering above 0.5890. Such behaviour would suggest that demand is returning. If price instead closes repeatedly below 0.5880, the market may be moving toward the next support region rather than preparing for a sustainable rebound.
For this setup, sentiment should be treated as conditionally bullish: the fundamental backdrop offers reasons for recovery, but current momentum requires confirmation from price action.
Bollinger Bands (20,0,2): The key signal is whether price touches or moves below the lower band around the proposed entry and then closes back inside the bands. That would suggest selling pressure is easing and a mean-reversion move may be developing. If the bands expand downward while candles continue closing near the lower boundary, the bearish trend remains active and the BUY should be reconsidered.
Ichimoku Kinko Hyo (9,26,52): A bullish Tenkan-sen/Kijun-sen crossover would strengthen the setup, particularly if price recovers above the Kijun-sen. If price remains beneath the cloud and both lines slope downward, the broader intraday structure remains bearish. A recovery that stalls below the cloud should be treated as a corrective bounce rather than proof of a trend reversal.
Stochastic (5,3,3): The preferred confirmation is a bullish crossover from below 20, ideally accompanied by a higher low in price. This would suggest that downward momentum is weakening. However, the currently reported oversold conditions come from a different Stochastic configuration, so they cannot be treated as a direct reading of your specified 5,3,3 indicator.
Overall, 0.5885 is a reasonable level to monitor for a potential rebound, but the entry is not independently confirmed by live M15 chart data. The trade becomes more attractive if price holds support, Stochastic turns upward and price begins recovering toward the Bollinger middle band. A decisive break below support would invalidate the immediate rebound thesis.
Trade Recommendation
Entry: 0.58850
Take Profit: 0.59150
Stop Loss: 0.58650