Market Overview
CAD/CHF is approaching a decision point after retreating from its late-October highs. Historical data places the pair's recent peak near 0.5929 on 29 October, while subsequent market observations show a pullback toward the 0.5870–0.5890 area. This correction matters because the Canadian dollar had benefited from the Bank of Canada's 25-basis-point rate increase, yet the market has struggled to maintain its earlier upward momentum.
The monetary-policy differential remains favourable to CAD in principle. The Bank of Canada raised its overnight rate to 2.50% on 28 October, whereas the Swiss National Bank maintained its policy rate at 0% at its September meeting. Higher Canadian yields may support demand for CAD relative to CHF, particularly when investors are comfortable holding risk-sensitive currencies. Nevertheless, this advantage is not sufficient by itself to guarantee appreciation.
The more immediate concern is Canada's weakening economic momentum. Preliminary data showed that Canadian GDP contracted by 0.1% in September, against expectations for modest growth. This introduces a meaningful complication: the Bank of Canada has tightened policy, but a weakening economy could limit the sustainability of the Canadian dollar's gains. Meanwhile, the Swiss franc can attract defensive demand when investors become concerned about global growth or financial-market volatility.
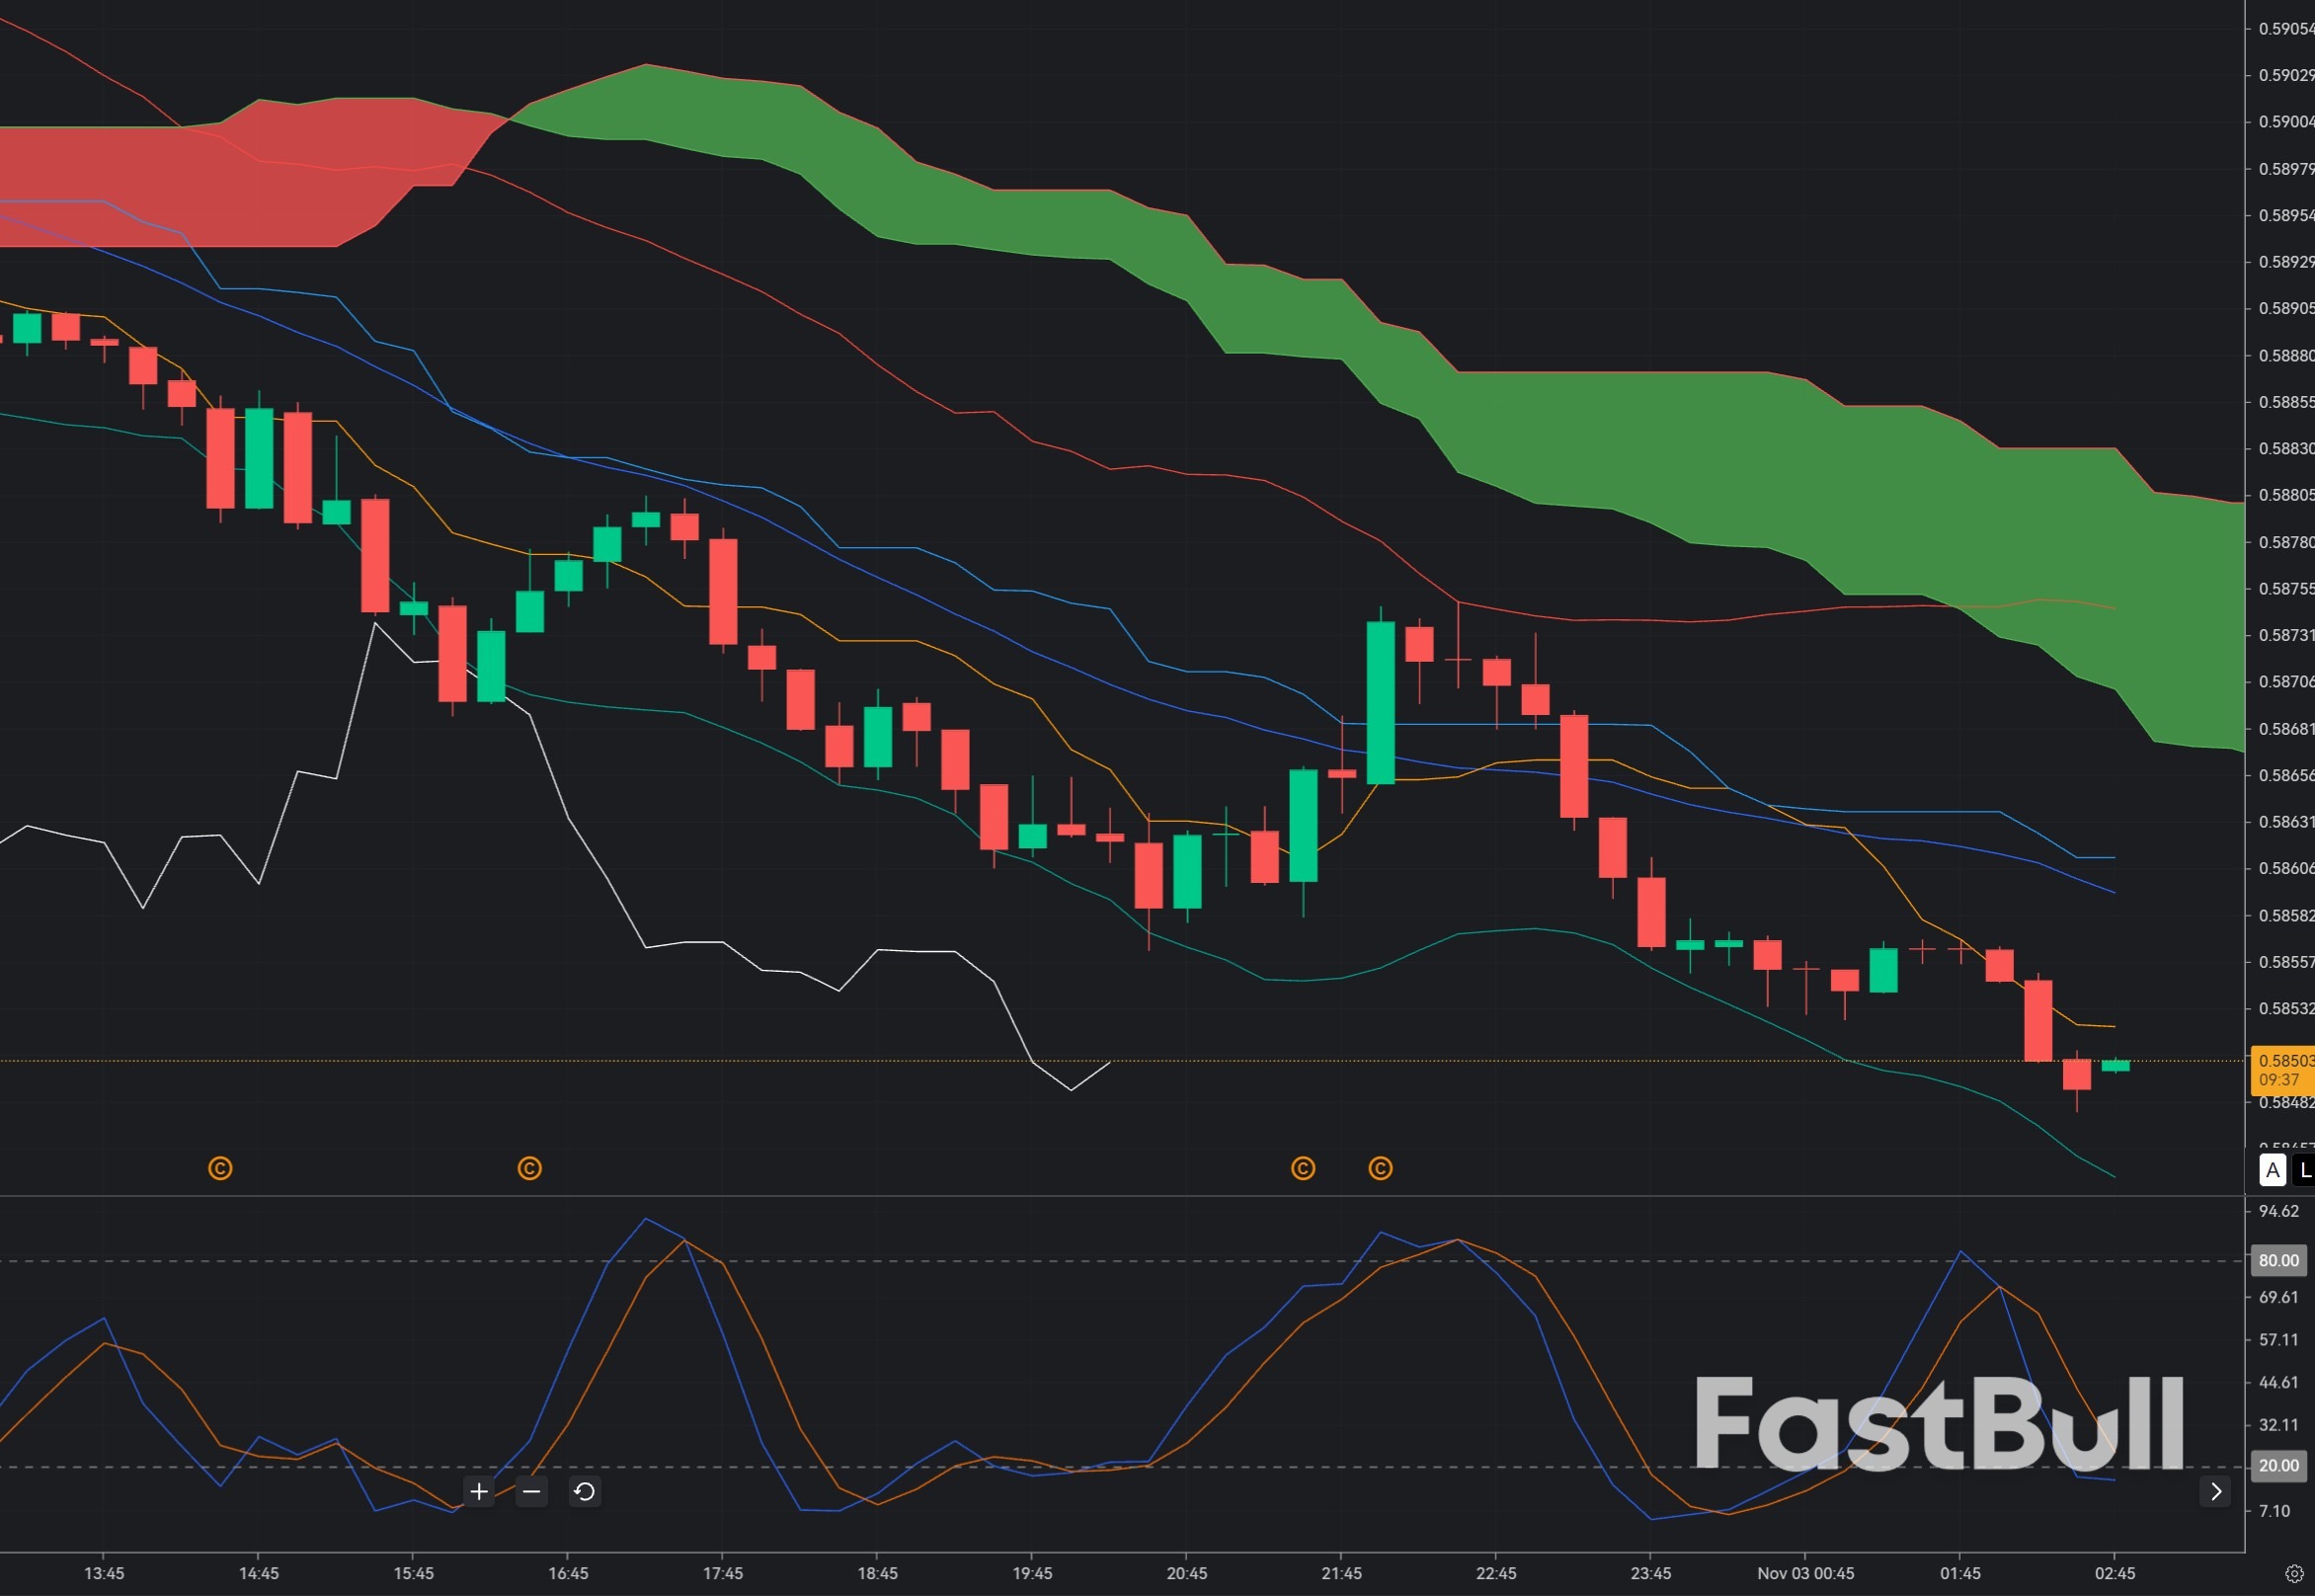
For a BUY at 0.5850, the key question is whether the decline represents a temporary correction within the broader advance or the beginning of a deeper reversal. Technical analysis identifies 0.5856 as nearby support, 0.5777 as a lower support reference and 0.5919 as resistance. A successful defence of the 0.5850–0.5856 region could create room for a recovery toward 0.5890 and subsequently 0.5919. A decisive breakdown, however, would undermine the bullish setup.
Market Sentiment
The sentiment picture is mixed rather than decisively bullish. The broader technical trend remains classified as bullish across short-, medium- and long-term horizons, but the latest pullback shows that sellers are challenging the market's upward structure. This combination can produce sharp two-way price action: buyers may defend established support, while sellers exploit disappointing Canadian data to push the pair lower.
The most important distinction is between a market that is oversold and one that has actually reversed. A decline toward 0.5850 may attract short-covering, especially if traders who sold near 0.5920 begin taking profits. However, if price repeatedly tests support without recovering, the selling pressure may indicate that buyers are withdrawing rather than accumulating positions.
For the BUY thesis to strengthen, CAD/CHF should show an identifiable rejection of lower prices, followed by a recovery above 0.5860–0.5870. Higher M15 lows would indicate that buyers are gradually regaining control. Conversely, consecutive bearish candles closing below 0.5850 would suggest that the market is repricing Canadian growth risks and that the lower support around 0.5777 may become relevant.
The immediate outlook therefore favours patience. The 0.5850 entry is attractive only if the market demonstrates that demand is present; the monetary-policy differential provides supporting context, not a substitute for confirmation.
Bollinger Bands (20,0,2): The preferred setup is a test of the lower Bollinger Band near 0.5850, followed by a candle closing back inside the bands. This would suggest that selling pressure is easing and a mean-reversion move may be developing. A recovery toward the middle band would provide the first upside objective, while a move toward the upper band could support an extension toward 0.5910–0.5919. If the bands expand downward and price repeatedly closes near the lower boundary, the decline is more likely to represent sustained bearish momentum than a temporary oversold condition.
Ichimoku Kinko Hyo (9,26,52): The Tenkan-sen and Kijun-sen should be monitored for a bullish crossover around support. A recovery above both lines would strengthen the entry, particularly if price subsequently approaches the Ichimoku cloud. If CAD/CHF remains below the cloud while both lines slope downward, the broader intraday structure remains bearish. In that situation, a bounce from 0.5850 should be treated as a countertrend recovery rather than confirmation of a new bullish trend.
Stochastic (5,3,3): The preferred signal is a bullish crossover below 20, followed by rising momentum while price holds above 0.5850. This combination would suggest that selling pressure is weakening and buyers are beginning to regain control. However, Stochastic can remain oversold during a strong downtrend. A crossover without a corresponding price recovery is therefore insufficient justification for entering a BUY position.
The combined technical thesis is straightforward: support must hold, momentum must turn upward, and price should recover above nearby resistance. The wider trend provides some support for this approach, but the latest available data does not establish the live M15 readings of your three indicators. These are confirmation conditions rather than claims that the signals have already appeared.
Trade Recommendation
Entry: 0.58500
Take Profit: 0.58900
Stop Loss: 0.58250