Overview
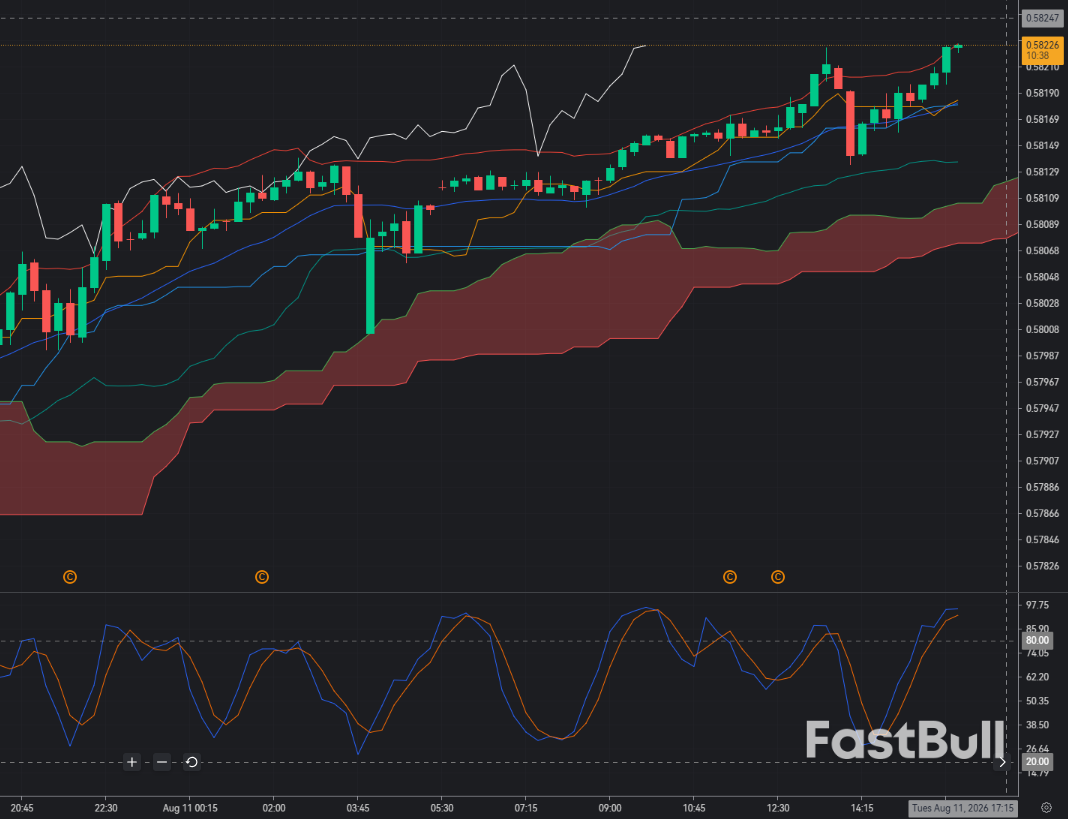
CAD/CHF has moved sharply higher into the 0.5820 region after repeatedly holding above the 0.5725 support area. Today's technical assessment from Economies.com explicitly describes the pair as having renewed its bullish action, with price reaching approximately 0.5815. This is important because the proposed SELL at 0.582 is not positioned against an established downtrend; instead, it attempts to capture a possible reversal at the upper boundary of the current move.
The Canadian side of the pair has a relatively constructive fundamental backdrop. Canada's economy expanded by 3.4% in Q2, its strongest quarterly performance in more than three years, and analysts surveyed by Reuters expect the Canadian dollar to remain broadly range-bound before gaining modestly over a longer horizon. The Bank of Canada is expected to maintain a cautious policy stance, meaning CAD strength is not being driven exclusively by aggressive rate expectations.
At the same time, CHF can strengthen quickly when global risk sentiment deteriorates. This creates a potential catalyst for CAD/CHF downside, but the technical confirmation is currently missing. The key question is whether 0.5820 represents exhaustion after the latest rally or simply another level that buyers will break.
Market Sentiment
The short-term sentiment is currently tilted toward CAD strength. The pair has moved from the lower 0.57 region toward 0.5820, while current technical commentary identifies repeated positive closes above 0.5725 as evidence that buyers remain in control. Therefore, blindly selling at 0.5820 would carry significant counter-trend risk.
Nevertheless, the proximity of 0.5820 is technically interesting because the pair has already travelled considerably from its recent support. If buyers fail to establish sustained M15 closes above 0.5820 and Stochastic begins turning lower from an overbought condition, short-term profit-taking could become increasingly likely. The bearish case would become much stronger if CHF demand simultaneously increases through a broader risk-off move.
The fundamental picture therefore creates a two-sided market. Canada's improving economic backdrop favours CAD, while the Swiss franc can benefit disproportionately from defensive positioning. A reversal requires the second force to become stronger than the first, and the M15 chart needs to show that transition before the SELL becomes technically convincing.
Technical Analysis
Using Bollinger Bands (20,0,2), price approaching 0.5820 while remaining close to the upper band indicates strong momentum rather than an automatic reversal. A bearish setup would become more credible if price tests the upper band around 0.5820, fails to break higher, and then closes back inside the bands. That would indicate that buying pressure is being absorbed at resistance.
With Ichimoku (9,26,52), the current bullish structure remains the main obstacle for the SELL. Price needs to lose the Tenkan-sen and subsequently weaken toward the Kijun-sen. A move through the Kumo would provide substantially stronger evidence that the larger M15 trend has actually changed. Until that happens, a SELL is effectively attempting to catch the top of an existing bullish move.
For Stochastic (5,3,3), the most useful bearish signal would be a bearish crossover from the overbought area combined with a failed test of 0.5820. Stochastic alone should not trigger the trade because strong trends can keep the oscillator elevated for an extended period. The strongest setup would therefore require three conditions to align: rejection around 0.5820, bearish Stochastic crossover, and deterioration of the Ichimoku structure.
The technical map is straightforward: 0.5820–0.5830 is the immediate resistance/rejection zone, while 0.5780–0.5750 represents the more meaningful downside region if a reversal develops. The major structural support remains around 0.5725, which current analysis identifies as the level above which the bullish trend remains intact.
Trade Recommendation
Entry: 0.582
TP: 0.580
SL: 0.583