Overview
CAD/CHF is currently around 0.5848, with today's observed range approximately 0.5847–0.5856. The pair opened near 0.5851 and has so far failed to recover meaningfully, following yesterday's decline from 0.5875 toward 0.5848. The sequence is important: CAD/CHF closed around 0.5894 on September 17, 0.5879 on September 18 and 0.5850 on September 21, showing that sellers have controlled the pair over several sessions rather than producing only one isolated bearish candle.
Nevertheless, 0.5848 is not an arbitrary level. The pair repeatedly traded around 0.5840–0.5850 during early September, while September 7 recorded a low near 0.5841 and September 10 reached 0.5854 before recovering. This gives the proposed entry a historical demand reference. A successful M15 stabilization around 0.5848 could therefore produce a technical mean-reversion move toward 0.5860–0.5870.
The CAD side is receiving some support from oil and hawkish comments from Bank of Canada Governor Tiff Macklem, who warned that persistent energy prices could push inflation higher and leave the BoC balancing between holding and raising rates. That is a headwind for CAD/CHF buyers. However, CHF positioning and the broader risk environment can also generate rapid reversals, particularly if safe-haven demand for CHF increases. The BUY therefore depends primarily on price defending 0.5848 rather than on a strong fundamental CAD advantage.
Market Sentiment
The most important contradiction in the current setup is that short-term technical momentum is clearly bearish while price is approaching established support. Current technical data classify CAD/CHF as Strong Sell, with RSI(14) around 26.2, MACD negative, ADX around 38 and all listed moving averages from MA5 through MA200 producing Sell signals. This indicates that the pair is in a genuine bearish phase, not merely drifting sideways.
At the same time, several oscillators are already deeply oversold. Stochastic is around 14.4, StochRSI around 12.9 and Williams %R at -100. This creates the specific condition required for the BUY: sellers have strong directional control, but the market is becoming stretched as price approaches a historical support region.
The recent price structure reinforces this tension. CAD/CHF reached 0.5906 on September 17 before declining to 0.5848, meaning approximately 58 pips of downside has already occurred in only a few sessions. A continuation through 0.5840 would expose lower levels, whereas repeated rejection of 0.5848 followed by an M15 higher low would provide the first evidence that the selling impulse is losing efficiency.
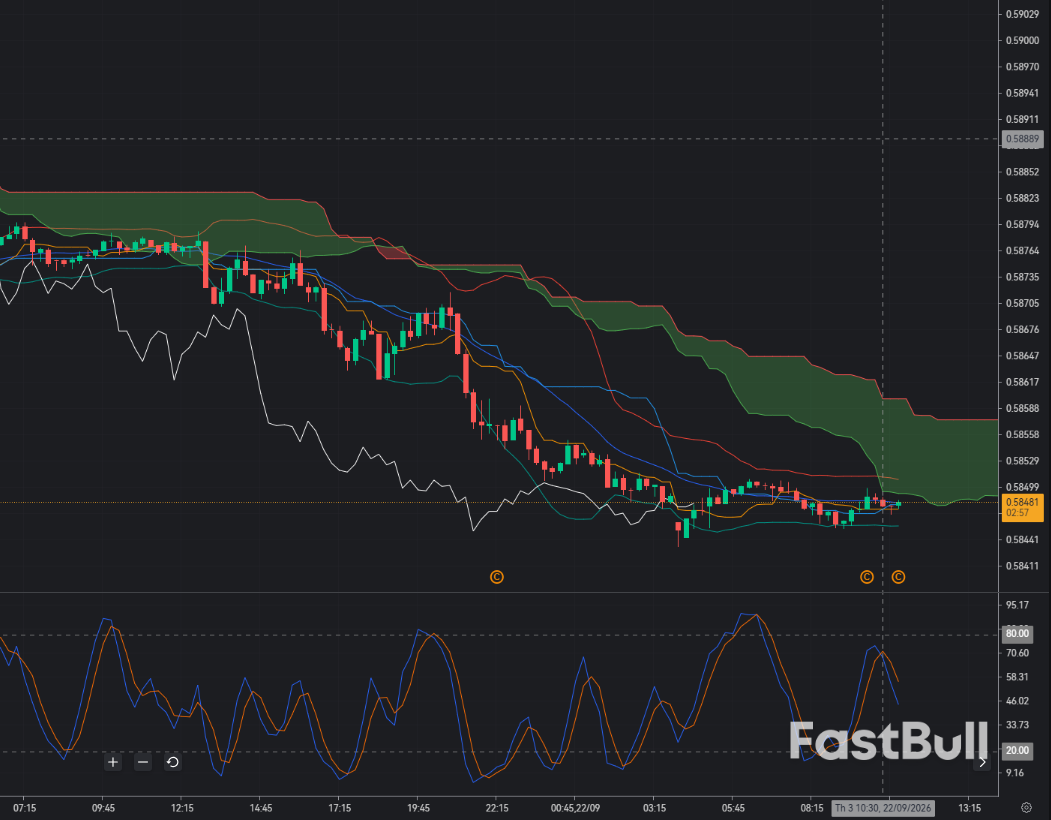
On M15, 0.5848 should be treated as a support-reversal trigger. The immediate structural area is approximately 0.5840–0.5848, based on repeated early-September lows. The first recovery zone is around 0.5860–0.5870, where previous daily trading activity and the short-term moving averages create overhead supply.
With Bollinger Bands (20,0,2), the setup is attractive only if price touches or briefly pierces the lower band around 0.5848 and then closes back inside the bands. Because volatility is currently relatively contained according to ATR data, a bullish mean-reversion candle from the lower band could develop into a move toward the middle band. Buying while price continues hugging the lower band without rejection would instead risk catching a falling market.
For Ichimoku (9,26,52), the BUY needs price to first reclaim the Tenkan-sen and subsequently challenge the Kijun-sen. The larger cloud should still be treated as resistance until price can establish itself above it. The strongest M15 configuration would therefore be a rejection around 0.5848, followed by a Tenkan recovery and a bullish Tenkan/Kijun cross.
The Stochastic (5,3,3) is the key timing indicator. The current broader Stochastic readings are already oversold, consistent with the M15 bearish momentum. A BUY becomes technically stronger only if the fast line crosses upward from the oversold area while price remains above 0.5845–0.5848. If Stochastic stays pinned near oversold while price repeatedly makes new lows, the market is displaying continuation pressure rather than reversal pressure.
The first upside objective is 0.5865, followed by 0.5875–0.5880. A move toward 0.5890 would require a more substantial recovery and a break of the recent lower-high structure. Conversely, an M15 acceptance below 0.5840 would invalidate the immediate support-rebound thesis and indicate that sellers have converted the historical support zone into resistance. Given that current technical indicators remain strongly bearish, confirmation around the entry is particularly important for this BUY setup.
Trade Recommendation
Entry: 0.5848
Take Profit: 0.5865
Stop Loss: 0.5838