Fundamentals
The price of precious metals rose slightly due to uncertainty about the U.S. economic outlook. Previously, weak U.S. private sector employment data and the University of Michigan's consumer confidence index — both coming in below expectations — led traders to bet on an impending U.S. rate cut. Lower interest rates can reduce the opportunity cost of holding non-yielding gold, thereby supporting its price. On the other hand, signs that the U.S. government shutdown may be nearing an end could weaken the appeal of safe-haven assets like gold. Additionally, easing trade tensions between China and the U.S. — the world's two largest economies — may also weigh on gold prices in the short term. Gold investment demand remains robust. As of November 7th, holdings in SPDR Gold Trust, the world's largest gold ETF, increased to 1,042.06 tons, up 2.86 tons from the previous week. According to a World Gold Council report, Indian gold ETFs are seeing record capital inflows, with purchases this year approaching 850 million. The total assets of Indian gold ETFs now stand at $11 billion, holding 83.5 tons of gold. This wave of inflows is driven by a combination of factors, including gold hitting all-time highs, continued central bank buying, geopolitical uncertainty, and market expectations of Fed easing.
The U.S. dollar index has recently come under pressure, largely due to a string of weak U.S. economic data. The University of Michigan's consumer confidence index for November fell to 50.3, its lowest level since June 2022. Meanwhile, the ISM Manufacturing PMI for October dropped further to 48.7, remaining in contraction territory for the third consecutive month, reflecting slowing economic momentum. Against this backdrop, several Fed officials have made hawkish remarks. Vice Chair Philip Jefferson noted that current interest rates are close to a "neutral level" and that future rate cuts should proceed cautiously. New York Fed President John Williams also hinted that rates might remain unchanged in December. As a result, market expectations for a rate cut have cooled. According to CME's "FedWatch Tool," the probability of a 25-basis-point rate cut in December is now around 62%, indicating notable divergence in expectations while the market still leans toward easing. In the short term, hawkish comments from Fed officials are limiting gold's upward momentum, as the market gradually considers the reduced likelihood of a December rate cut. However, medium- to long-term allocation funds continue to enter the market at lower levels, providing structural support for gold prices. Currently, the U.S. government shutdown has delayed the release of key data, including CPI, PPI, and retail sales. The absence of such data may keep gold range-bound in the near term. Nevertheless, rising economic risks from the shutdown, downward pressure on U.S. stocks, and the ongoing trend of global central bank gold purchases all bode well for gold's long-term outlook. If gold can effectively break through the key resistance level of $4,030, it may attract fresh buying interest and initiate a new upward trend. At this stage, any price pullback may be seen as an opportunity for medium- to long-term allocation, as the market awaits a confluence of fundamental and capital-driven catalysts to trigger a breakout.
Technical Analysis
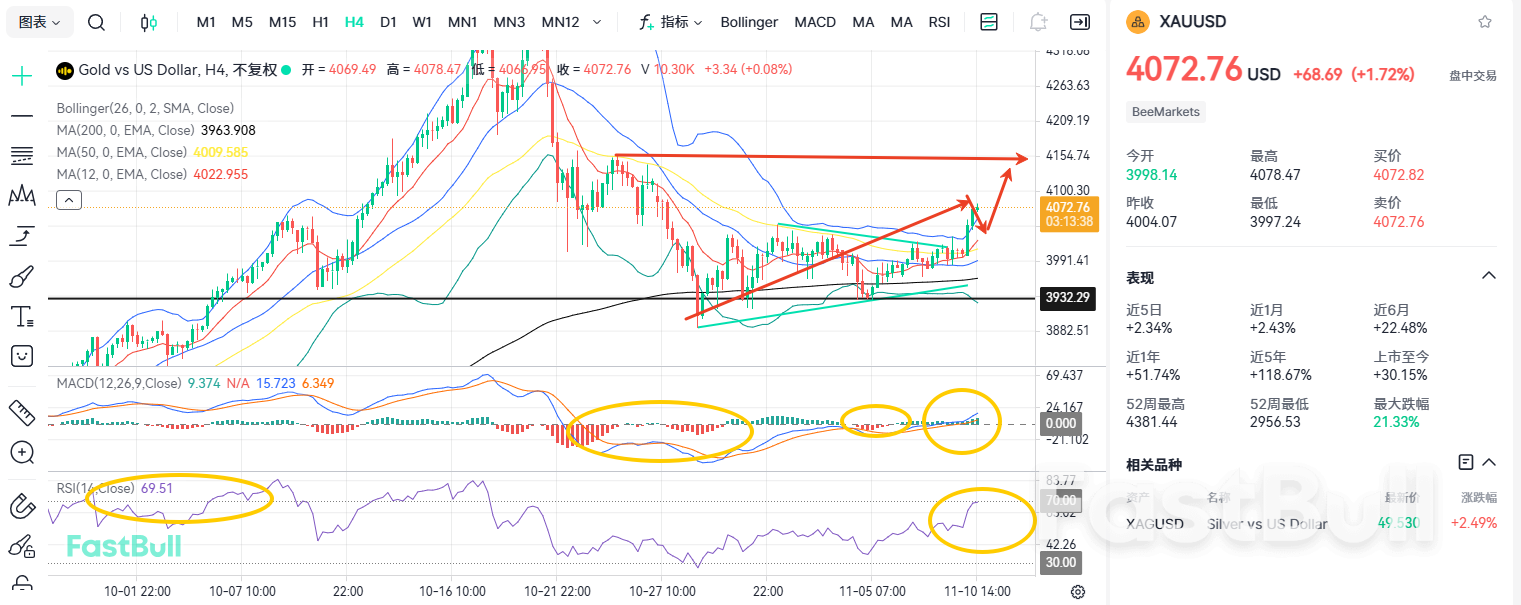
Based on the 4-hour chart, gold broke above the upper boundary of the triangle pattern. If subsequent retracements do not fall back within the range, the breakout will be confirmed as valid, likely leading to a rally toward the psychological level of $4,100. The MACD moved above the zero axis and formed a "kiss of the angels" (bullish convergence) pattern. In addition, downward momentum is gradually weakening, with lows becoming higher, signaling a potential bottom reversal — suggesting a high probability of further upside. The RSI stands at 69, indicating strong bullish sentiment in the market.
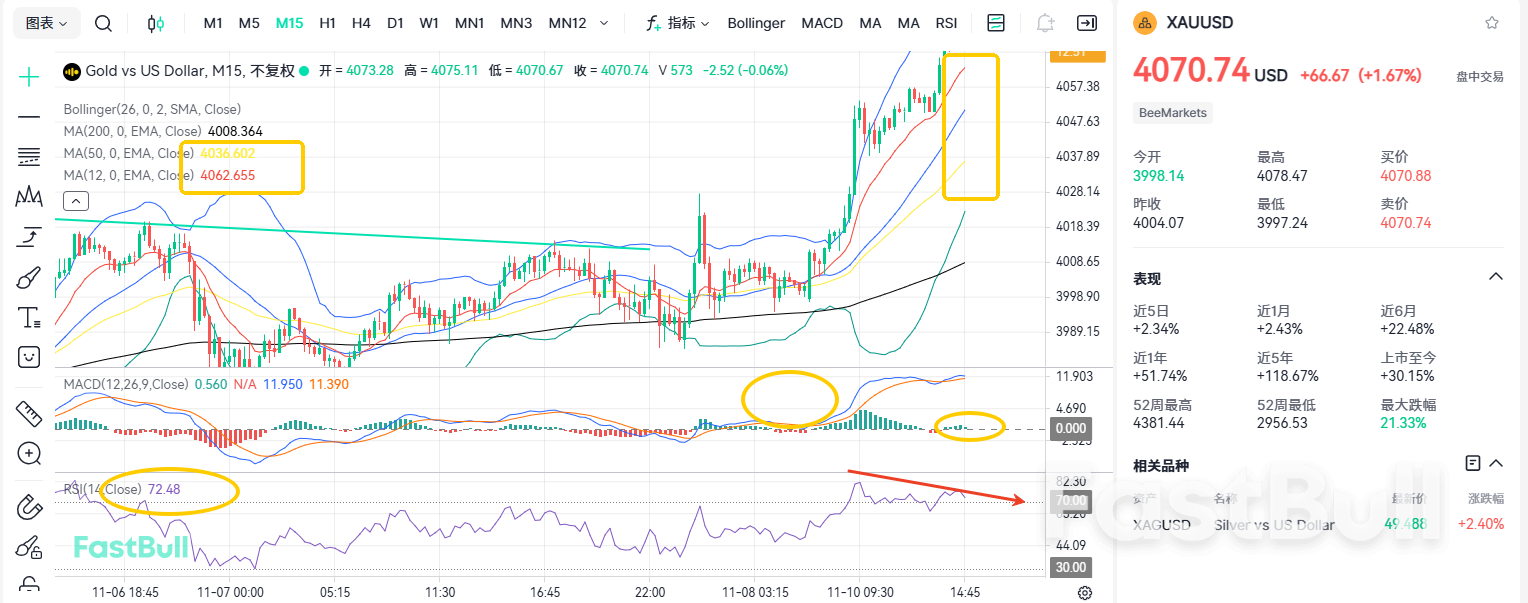
Regarding the 15-minute chart, however, the MACD bullish momentum is gradually weakening even as prices make new highs — a sign of a potential top divergence, which suggests a higher likelihood of a short-term pullback. Key support levels include the Bollinger Middle Band and the EMA 50, at 4,036, respectively. The RSI is at 72, indicating that the price is in overbought territory. If the price can stabilize above the EMA 50 after a pullback, it is likely to test the next resistance platform around $4,133. Thus, buying at lows is recommended.
Trading Recommendations:
Trading direction: Buy
Entry price: 4040
Target price: 4400
Stop loss: 3750
Support: 3900/3800/3600
Resistance: 4380/4500/5000


