Global Markets

News
Columns
7x24
Economic Calendar
Quotes

Data

Data Warehouse Market Trend Institutional Data Policy Rates Macro

Market Trend

Speculative Sentiment Orders and Positions Correlation

Popular Indicators

Analysis
AI Signal

Trading Signals

AI Signal

Pro
Recent Searches
    Trending Searches
      News
      7x24
      Quotes
      Economic Calendar
      Video
      Data
      • Names
      • Latest
      • Prev.

      View All

      No data

      Sign in

      Sign up

      Membership
      Quick Access to 7x24 Real-time Quotes
      Upgrade to Pro

      --

      • My Favorites
      • Following
      • My Subscription
      • Profile
      • Orders
      • FastBull Pro
      • Account Settings
      • Sign out

      Scan to download

      Faster Financial News and Market Quotes

      Download App
      Reminder Settings
      • Economic Calendar
      • Quotes/Market Quotes

      Reminders Temporarily Unavailable

      I have a redeem code

      Rules for using redeem codes:

      1.The activated redeem code cannot be used again

      2. Your redeem code becomes invalid if it has expired

      Redeem
      FastBull Membership Privileges
      Quick Access to 7x24
      Quick Access to More Editor-selected Real-time News
      Real-time Quotes
      View more faster market quotes
      Upgrade to FastBull Pro
      I have read and agreed to the
      Pro Policy
      Feedback
      0 /250
      0/4
      Contact Information
      Submit
      Invite

      AUD/JPY at 110.70: Is the Rally Losing Momentum at Resistance?

      Gerik

      Forex

      Summary:

      On 20 October 2026, AUD/JPY is trading around 110.70 after rebounding strongly from an eight-month low near 108.65 last week. The pair has recovered as hawkish Reserve Bank of Australia commentary and stronger Chinese economic growth supported the Australian dollar...

      Sell

      AUDJPY

      End Time
      CLOSED

      110.700

      Entry Price

      110.400

      TP

      110.900

      SL

      110.939 +0.194 +0.18%

      300

      Points

      Profit

      110.400

      TP

      110.399

      CLOSING

      110.700

      Entry Price

      110.900

      SL
      Market Overview

      The Australian dollar is benefiting from a combination of stronger domestic rate expectations and improving sentiment toward China, Australia's largest trading partner. Recent Chinese GDP data and hawkish comments from RBA Assistant Governor Christopher Kent have helped AUD/JPY recover toward 110.70. This recovery is important because it suggests that buyers are returning after the pair's decline toward 108.65. However, stronger momentum also means that a SELL entry must be supported by evidence of rejection rather than an assumption that the rally has gone too far.
      The Japanese yen remains vulnerable because the Bank of Japan's policy outlook is uncertain. A cautious approach to further tightening can leave Japanese interest rates relatively unattractive compared with Australian yields, encouraging carry trades that favour AUD/JPY. Nevertheless, intervention risk remains relevant when yen weakness becomes excessive. Any official warning or abrupt shift in Japanese policy expectations could trigger a rapid reversal in yen crosses.
      The immediate macroeconomic conflict is therefore clear: Australia's relatively hawkish policy outlook supports the Australian dollar, while possible intervention and changing risk sentiment could support the yen. For a short-term SELL at 110.70, the strongest rationale is a technical rejection at resistance, not a broad assumption that the yen must strengthen.

      Market Sentiment

      The latest technical dashboard shows a strong-buy reading, with 12 moving-average buy signals and nine bullish technical-indicator signals. RSI(14) is 70.32, MACD is positive at 0.170, and ADX(14) is 51.04. These readings indicate strong directional momentum, but RSI above 70 also warns that the rally may be stretched in the short term. Importantly, an overbought RSI is not itself a sell signal: strong trends can remain overbought for extended periods.
      The key distinction is between a temporary pullback and a genuine reversal. If AUD/JPY fails near 110.70–110.75, forms a lower high and breaks its nearest M15 swing low, a tactical short may become attractive. If price consolidates above 110.70 and continues making higher highs, selling would mean fighting an active bullish trend.
      For execution, prioritise a bearish candle close and confirmation from the Stochastic (5,3,3) rather than entering solely because RSI is elevated. A failed breakout followed by a retest of 110.70 from below would offer stronger evidence that resistance has held.

      Technical Analysis

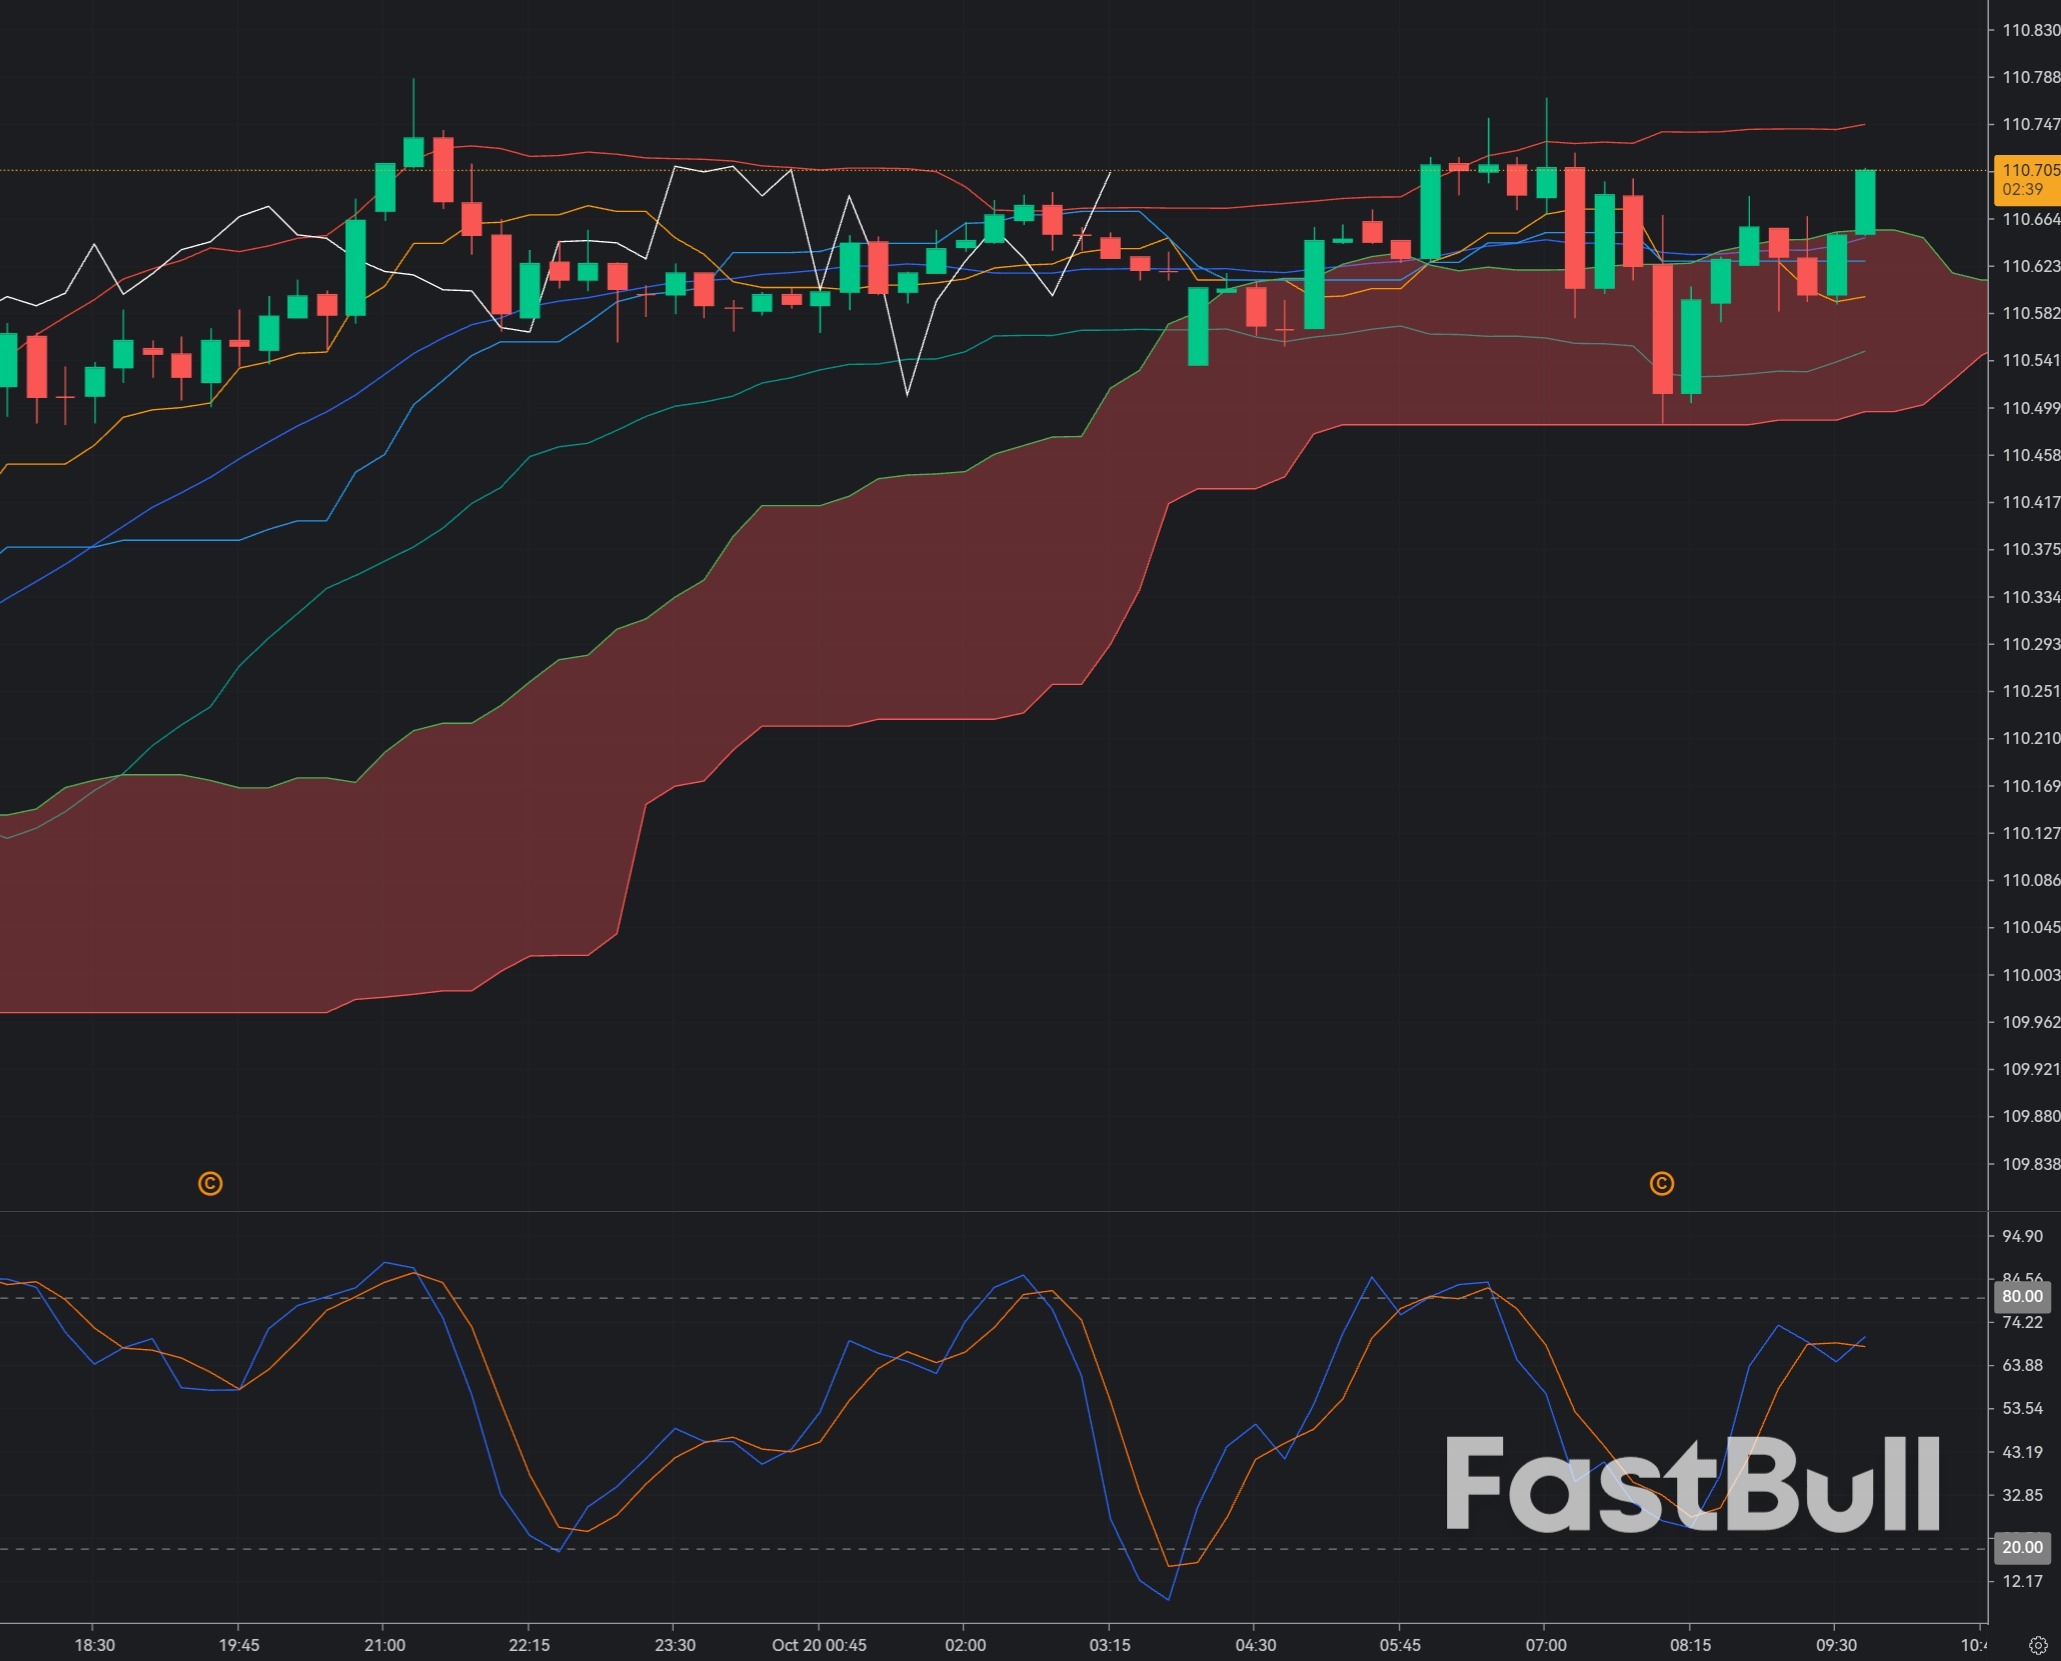
      AUD/JPY at 110.70: Is the Rally Losing Momentum at Resistance?_1
      Bollinger Bands (20,0,2): The latest dashboard places the classic pivot at 110.64, with resistance at 110.67, 110.71 and 110.74.
      The SELL setup becomes more convincing if price tests the upper M15 band near 110.70–110.74 and closes back inside the envelope. If the bands expand upward and candles continue closing near the upper band, bullish continuation remains the higher-risk scenario for sellers.
      Ichimoku Kinko Hyo (9,26,52): Live M15 Tenkan-sen, Kijun-sen and cloud values could not be independently verified. Look for price to break below Tenkan-sen and Kijun-sen, with a bearish crossover and resistance from the Kumo overhead. If price remains above a bullish cloud, a sell should be treated as a short countertrend scalp rather than a confirmed reversal.
      Stochastic (5,3,3): The preferred signal is a bearish crossover from the upper region, ideally after price rejects 110.70–110.74. Confirmation improves if the crossover coincides with a lower high and a bearish candle close. If Stochastic remains elevated while price continues breaking resistance, avoid forcing the short.
      The first downside references are 110.60 and 110.53, followed by 110.40 if selling accelerates. A sustained M15 close above 110.74 would weaken the immediate rejection setup. These levels are intraday pivot references, not guarantees of price movement.

      Trade Recommendation

      Entry: 110.70
      Take Profit: 110.40
      Stop Loss: 110.90
      Risk Warnings and Investment Disclaimers
      You understand and acknowledge that there is a high degree of risk involved in trading with strategies. Following any strategies or investment methodologies is the potential for loss. The content on the site is being provided by our contributors and analysts for information purposes only. You alone are solely responsible for determining whether any trading assets, or securities, or strategy, or any other product is suitable for you based on your investment objectives and financial situation.

      Quick Access to 7x24

      Quick Access to More Editor-selected Real-time News

      Exclusive video for free

      FastBull project team is dedicated to create exclusive videos

      Real-time Quotes

      View more faster market quotes

      More comprehensive macro data and economic indicators

      Members have access to entire historical data, guests can only view the last 4 years

      Member-only Database

      Comprehensive forex, commodity, and equity market data

      FastBull
      English
      English
      العربية
      繁體中文
      简体中文
      Bahasa Melayu
      Bahasa Indonesia
      ภาษาไทย
      Tiếng Việt
      Telegram Instagram Twitter facebook linkedin App StoreGoogle Play
      Copyright © 2026 FastBull Ltd
      Home News Columns 7x24 Economic Calendar Quotes Video Data WarehouseAnalysis AI Signal Pro User Agreement Privacy Policy About Us

      Risk Disclosure

      The risk of loss in trading financial assets such as stocks, FX, commodities, futures, bonds, ETFs or crypto can be substantial. You may sustain a total loss of the funds that you deposit with your broker. Therefore, you should carefully consider whether such trading is suitable for you in light of your circumstances and financial resources.

      No consideration to invest should be made without thoroughly conduct your own due diligence, or consult with your financial advisors. Our web content might not suit you, since we have not known your financial condition and investment needs. It is possible that our financial information might have latency or contains inaccuracy, so you should be fully responsible for any of your transactions and investment decisions. The company will not be responsible for your capital lost.

      Without getting the permission from the website, you are not allow to copy the website graphics, texts, or trade marks. Intellectual property rights in the content or data incorporated into this website belongs to its providers and exchange merchants.