Iran has renewed its offer to reopen the Strait of Hormuz within seven days if Washington agrees to its conditions, although negotiations remain stalled over Tehran’s nuclear program. Meanwhile, continued attacks on vessels in the Strait of Hormuz and clashes between Saudi Arabia and the Houthis are keeping risks to energy supplies elevated. However, US President Donald Trump’s decision to temporarily suspend sanctions on Russia has increased expectations that additional energy supplies could reach the market, potentially easing some of the pressure on prices.
Elevated energy prices linked to the war in the Middle East continue to fuel inflation, with both the September Consumer Price Index (CPI) and Producer Price Index (PPI) reports coming in higher than expected. These figures reinforce expectations of another interest rate increase before the end of the year, as the Federal Reserve seeks to bring inflation back toward its 2% target. Persistent energy-related price pressures could complicate the outlook for monetary policy, particularly if they continue to affect broader consumer and production costs.
Recent comments from Fed officials also suggest that policymakers remain open to further tightening, although they have not firmly indicated that rates will be raised at the October 27–28 meeting. Speaking in Bangkok on Friday, Fed Chair Kevin Warsh maintained his position of avoiding forward guidance, stating, “I do not prejudge meetings.” His comments leave the timing of any potential rate increase uncertain, with incoming economic data and inflation developments likely to remain central to the Fed’s decisions.
US Treasury yields moved higher amid the latest inflation figures and expectations for monetary policy. The two-year Treasury yield, which is more sensitive to the Fed’s short-term interest rate decisions, increased by more than 3 basis points (bps) to 4.778%. Meanwhile, the 10-year Treasury yield rose by more than 4 bps to 5.144%, while the 30-year Treasury yield also gained more than 4 bps, reaching 5.476%. The broad increase across maturities reflects continued pressure on the bond market as investors assess the potential implications of persistent inflation and higher interest rates.
In Canada, the Bank of Canada’s (BoC) preferred measure of core inflation declined to 2.2% from 2.4%, while underlying prices remained unchanged on a monthly basis. The absence of monthly growth in core prices suggests that domestic inflationary pressures may be moderating, providing a reason for the BoC to maintain its benchmark interest rate at 2.25%. However, the outlook remains sensitive to developments in energy markets, as a prolonged period of elevated prices could eventually complicate the central bank’s efforts to keep inflation under control.
BoC Governor Tiff Macklem addressed a roundtable during the annual meetings of the International Monetary Fund and the World Bank in Bangkok. According to Reuters on Friday, Macklem said Canada had not yet raised interest rates in response to higher energy prices, but warned that maintaining this position would become more difficult if prices remained elevated for an extended period.
“We have not raised our rates yet. We have been looking through the increase in energy prices, but the longer this continues, the harder it will be to do so,” Macklem said. His remarks highlight the challenge facing the central bank as it weighs the temporary impact of higher energy costs against the risk that persistent price pressures could eventually require a tighter monetary policy stance.
Technical Analysis
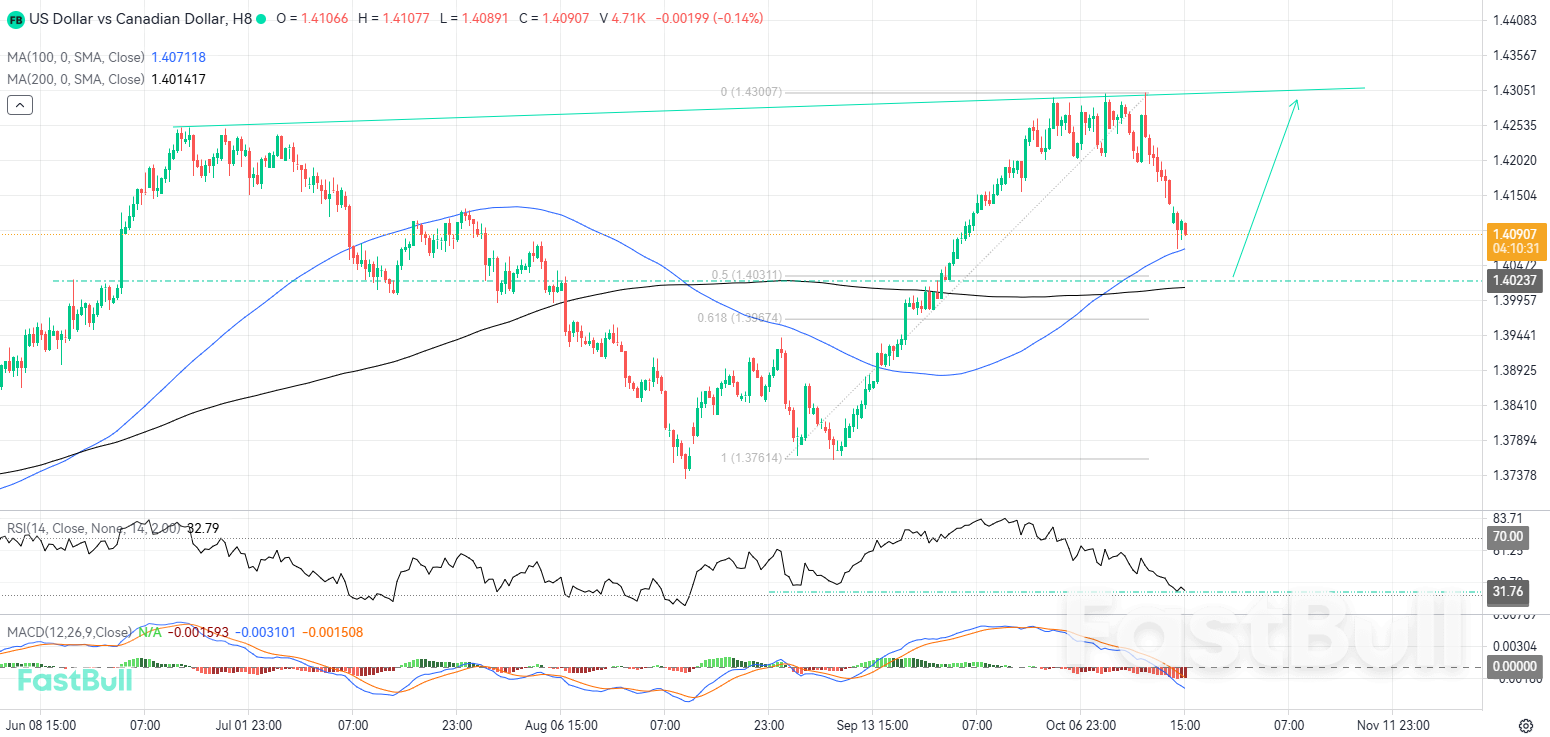
USDCAD reached a local high near 1.4300 following a strong bullish move that began around 1.3761 on September 8, advancing with very limited pullbacks along the way. However, after reaching this resistance area, the pair began a corrective move to the downside. The decline recently brought the price closer to the 100-period moving average, currently positioned at 1.3926, while the 200-period moving average is located somewhat higher at 1.4019. This latter level also coincides with the 0.50 Fibonacci retracement, making the area around 1.4019 a potential zone of interest if the correction extends further. Should the price reach this area and reject it to the upside, buying opportunities could emerge for traders looking to join the broader bullish trend.
Looking at the oscillators, the RSI is currently near 31 and approaching oversold territory. Notably, the RSI readings during the current pullback have fallen below the levels observed at the beginning of the preceding bullish advance, suggesting a potential divergence between momentum and the broader price movement. This may indicate that bearish momentum is weakening and that buyers could regain control if price action confirms a rejection at key support. Meanwhile, the MACD displays a bearish histogram that has recently started to lose depth, pointing to a possible slowdown in selling pressure. Although the signal lines have only recently crossed into bearish territory, they could return to bullish territory if upward momentum resumes. Therefore, a bullish rejection at the relevant support zone, combined with further improvement in the oscillators, could provide opportunities to enter in the direction of the prevailing uptrend.
Trading Recommendations
Trading direction: Buy
Entry price: 1.4023
Target price: 1.4280
Stop loss: 1.3930
Validity: Oct 30, 2026 15:00:00


